Understanding Presentations – Charts
Create built-in charts in a presentation: column, bar, line, pie.
In Impress, we can represent our data with the help of different graphical representations like column chart, bar chart, line chart, or pie chart. This makes the data more presentable and also easier to comprehend.


To create the different types of charts in Impress, simply click on the ‘Insert Chart’ place holder from the main slide area as has been shown in the below given illustration.
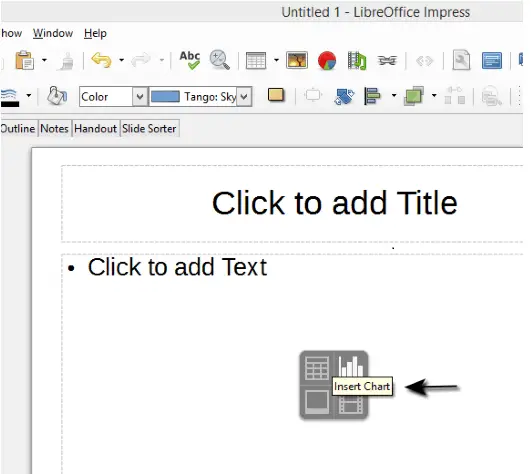
This will directly insert a chart into the presentation which will be first displayed in the selected state.
Select a chart.
A chart can be selected by simply double-clicking on it. When selected, the chart is surrounded by a grey border.
Change the chart type.
In order to change the chart type, first of all we need to select the chart by double-clicking on it. The chart will become surrounded by a grey border upon selection. After selecting the chart, click on ‘Format’ button on the main menu bar. From the resulting drop-down, click on ‘Chart Type’.
After clicking on the ‘Chart Type’ button, the ‘Chart Type’ dialog box appears. This lists the different chart types available. Any chart type can be selected from this list. After selection of the required chart type, just click on ‘OK’ and the chart type will get changed and a new chart will be created having the updated chart type.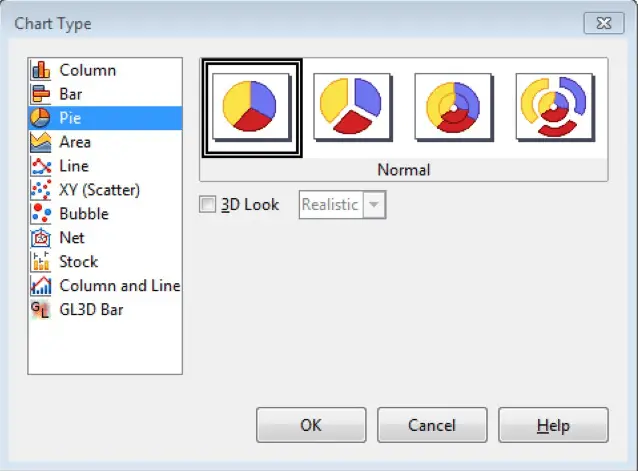
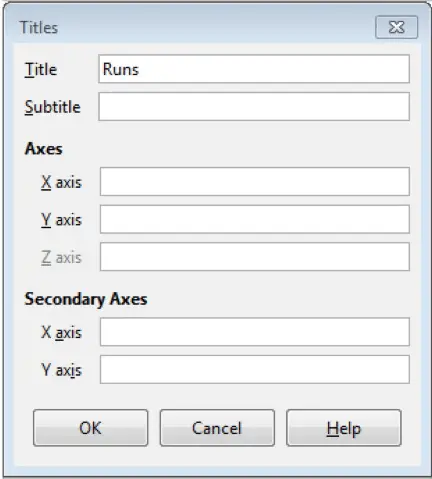
Add, remove, and edit a chart title.
To add a chart title, first of all select the chart by double clicking on it, and then right click on the chart area. This gives a menu from which ‘Insert Titles’ can be selected. This gives a ‘Title’ dialog box from where we can add a title, remove a title and also edit the title. If the title is already there, just delete the title and click on ‘OK’. This will remove the title. Similarly, by changing the title and clicking on ‘OK’, we can edit the title.