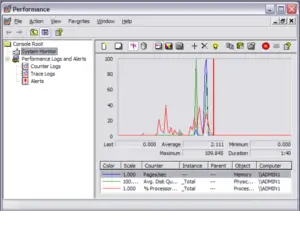
Performance Logs and Alerts
Windows allows alerts to be set so that if a certain counter goes over a specified limit, the Administrator can be alerted, e.g. If the Processor usage goes above 80% a network message will be sent to the administrator. Log files can be created to help analyse system performance and establish baselines values for the system, this will help to identify any subsequent aberrant behaviour. These logs can be viewed through the Windows System Monitor, and exported to a database or a spreadsheet application.
Use the buttons below to navigate through the lesson
Creating a Counter Log
To create a new log open the Performance Console and Expand Performance Logs and Alerts. Click on Counter Logs.
 This shows that there is a sample log in place. If the log is in red then it indicates that the log is currently not running. To create a new log, right-click on Counter Logs.
Select New Log Settings. Type in a name for the new log. Click on OK.
To add a counter to log, click on Add Counters.
Choose the counter to log and click on Add.
Once all counters have been added, click on Close.
The Processor Time counter has been added. The Sample data every control allows you to specify how often the data is recorded. The value can be lowered if a more accurate log is required. Note. The shorter the sample interval and the more counters added the more load on the system.
Click on the Log Files tab next.
Here the location of the log file is specified.
The Log file type sets a format for displaying in Excel or Word.
Explore the Schedule Tab next.
The maximum log file size can also be set.
The Schedule tab specifies when the log should start. Click on Manually (using the shortcut menu) to start the log manually and select OK.
To start the log, right-click on the Processor Performance log.
Click on Start.
Green indicates that the log has started. The file is located inside the “PerfLogs” folder. The log file can be opened with an application such as Excel and displayed as a graph or chart or in system monitor.
Remember to add the correct counters to system monitor before you import the log.
Creating an Alert
To create a new alert, right-click on Alerts.
Select New Alert Settings.
Type in a name for the new alert.
Click on Add to add a counter.
Select the relevant counter and click Add.
Once all necessary counters have been added, click on Close.
Change the Alert value to over 60%.
Click on the Action tab.
The form of the alert can be set here. (Having a network message sent is perhaps the most fun…)
Type in the IP address or name of the machine to which the message should be sent.
Click on the Schedule Tab.
The schedule tab specifies when the alert should start. Click on Manually to start the alert manually.
Click on OK to create the alert.
To start the alert, right-click on the Processor alert.
Click on Start.
Green indicates that the alert has started, and is ready for the triggering event.
Every time the processor time goes above 60% a network message is sent to 10.0.0.219. The alert is also logged to the event viewer.