Advanced Spreadsheets – Creating Charts
Create a combined column and line chart.
A combined column and line chart is a combination of two chart types. It is useful for combining two distinct but related data series. To create a combined column and line chart in Calc, first of all we need to select some data which we are going to represent with the help of this chart. After selecting the data, click on the ‘Insert’ button from the main menu bar and from the resulting drop-down click on ‘Chart’. This will open the chart wizard.


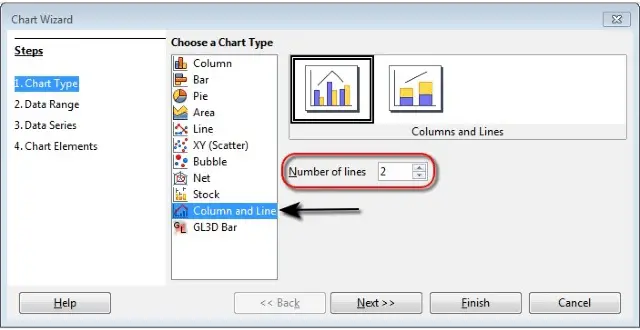
Here you can select ‘Column and Line’ from ‘Choose a Chart Type’. In ‘Number of lines’, you can select the number of lines required to be there in the chart. After selecting everything, click on ‘Next’.
This will open the ‘Data Range’ tab. Any changes, if required can be done here. Similarly on the click of ‘Next’, we’ll have the ‘Data Series’ and ‘Chart Elements’ tabs. Changes can be done in these tabs, but keeping the default values will also work fine. Finally, click on ‘Finish’.
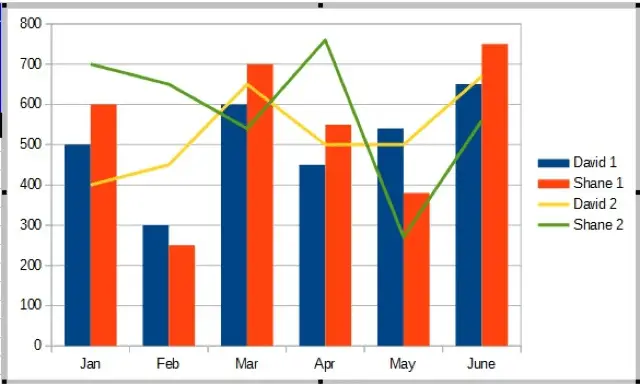
The combined column and line chart will get created.