Advanced Presentations – Changing Charts
Change the chart type for a defined data series.
In order to change the chart type of a chart which has been created for a defined data series, first of all we need to select the chart by double-clicking on it. The chart will become surrounded by a grey border upon selection. After selecting the chart, click on ‘Format’ button on the main menu bar. From the resulting drop-down, click on ‘Chart Type’. After clicking on the ‘Chart Type’ button, the ‘Chart Type’ dialog box appears.


You can also right-click anywhere on the chart area, and then from the resulting menu click on ‘Chart Type’. This will also open the ‘Chart Type’ dialog box.
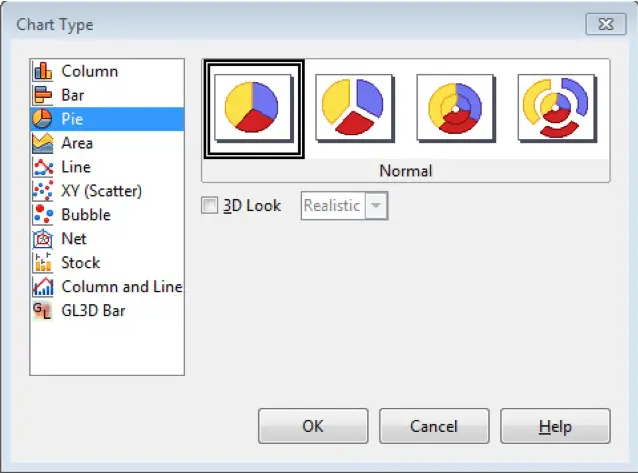
This lists the different chart types available. Any chart type can be selected from this list. After selection of the required chart type, just click on ‘OK’ and the chart type will get changed and a new chart will be created having the updated chart type.
Change the gap, overlap between columns, bars in a chart.
To change the gap or overlap between the columns or bars in a chart, first of all select the chart by double-clicking on it. After this, right-click on any of the bars or the columns, and from the resulting menu click on ‘Format Data Series’. This will open the ‘Data Series’ dialog box. In this dialog box, under the ‘Options’ tab, we have the ‘Spacing’ and ‘Overlap’ options under ‘Settings’. Select the appropriate values here and then click on ‘OK’. This will change the gap and the overlap between the columns or bars as per the values selected.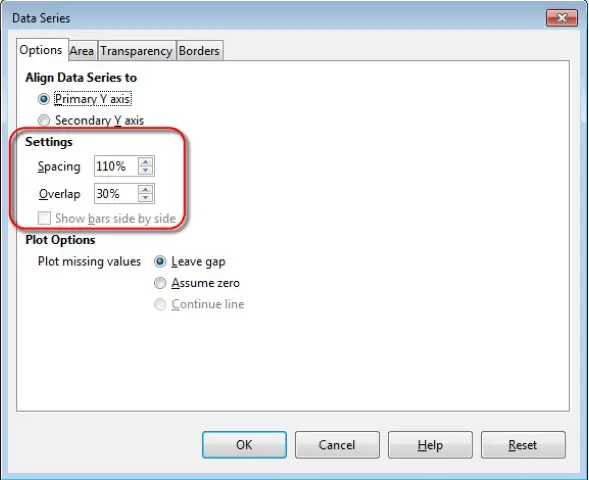
Format columns, bars, plot area, chart area to display an image.
In Impress, we cannot use custom images by importing them into the charts from our local machine. Though Impress does provide the option of using the different types of ‘Fill’ options for the columns, bars, plot area or chart area like ‘Color’, ‘Hatching’, ‘Gradient’, and ‘Bitmap’. These options can be used to format the different components of a chart by displaying different styles and images, but custom images cannot be used in Impress.
To use the ‘Fill’ option for columns or bars, double-click on the required column or bar. This will open a dialog box, where under the ‘Area’ tab you will find the ‘Fill’ drop-down list. From this list you can choose the required fill type.
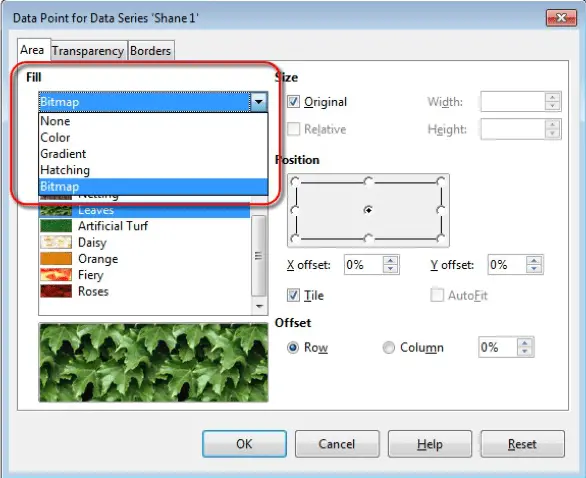
To use the ‘Fill’ option for plot area or chart area, double-click anywhere on the plot area or chart area of your chart and this will open a similar dialog box. In the same way as given above, in this dialog box under the ‘Area’ tab you will find the ‘Fill’ drop-down list. From this list you can choose the required fill type.
Change scale of value axis: minimum, maximum number to display, major interval between plotted numbers in a chart.
To change the scale of value axis, first of all select the chart. After this, click on ‘Format’ from the main menu bar, and from the resulting menu, click on ‘Axis’. This will display a sub-menu. Click on ‘X Axis’ or ‘Y Axis’ from this sub-menu as per the requirement. This will open the ‘X Axis’ or ‘Y Axis’ dialog box.
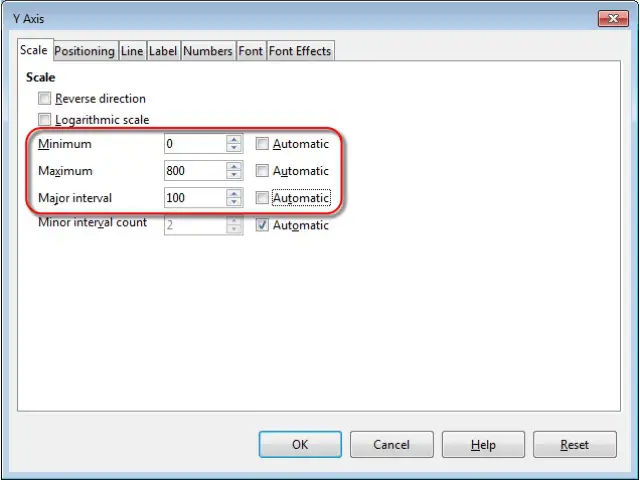
In this dialog box, under the ‘Scale’ tab, we have some options like ‘Minimum’, ‘Maximum’ and ‘Major interval’. Uncheck the ‘Automatic’ checkboxes in front of these options and then you can add the minimum and maximum numbers to be displayed, or the major interval between the axis values. After making all the changes, click on ‘OK’. The scale of value axis will get changed accordingly.