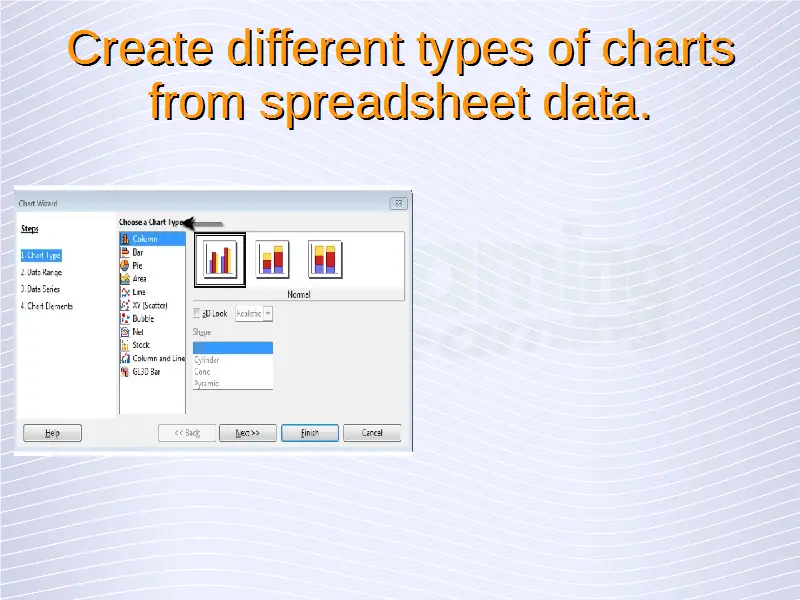
Create different types of charts from spreadsheet data: column chart, bar chart, line chart, pie chart.
In Calc, we can represent our data with the help of different graphical representations like column chart, bar chart, line chart, or pie chart. This makes the data more presentable and also easier to comprehend.


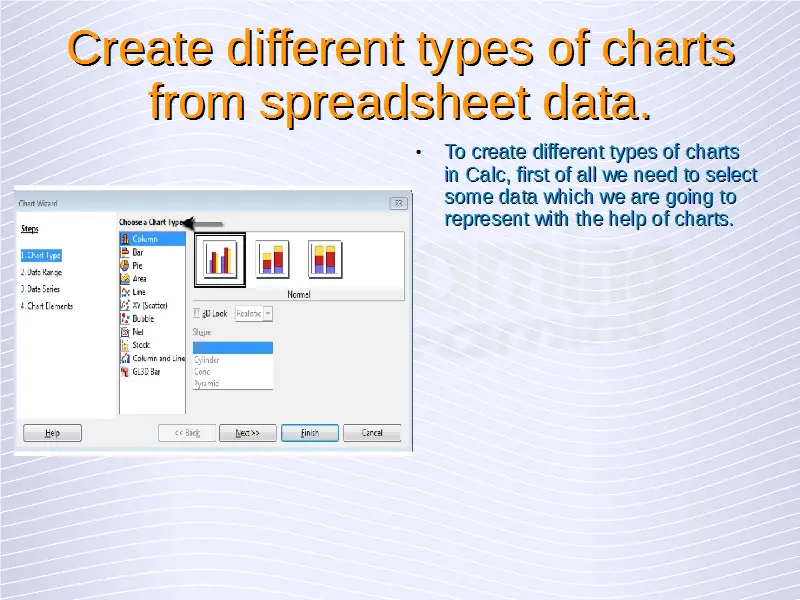
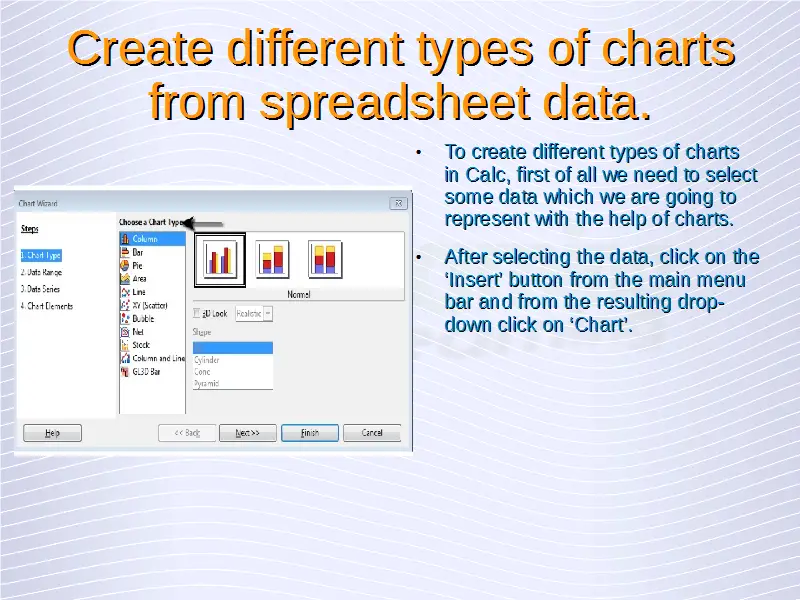
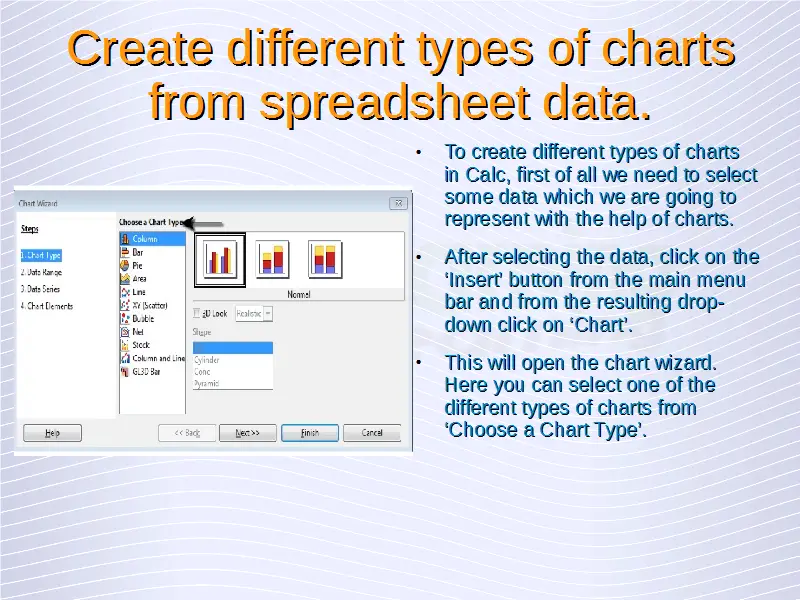
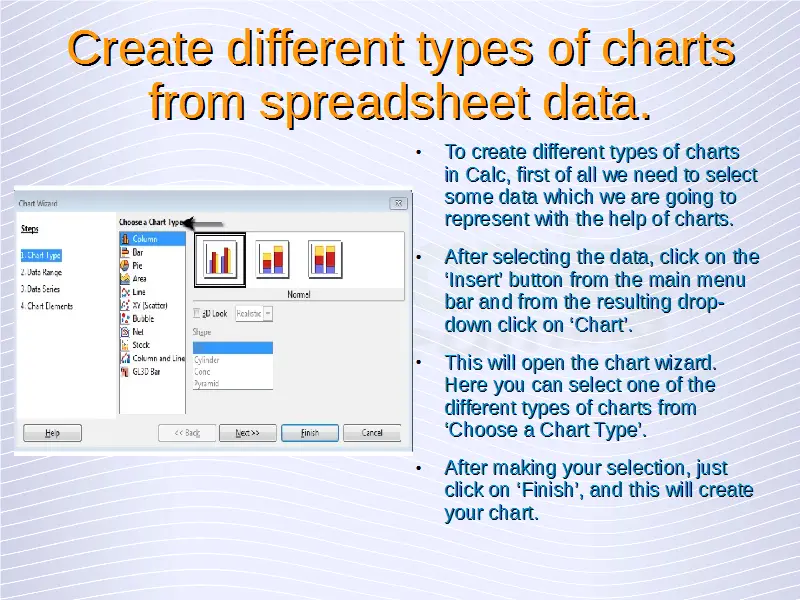
To create the different types of charts in Calc, first of all we need to select some data which we are going to represent with the help of charts.
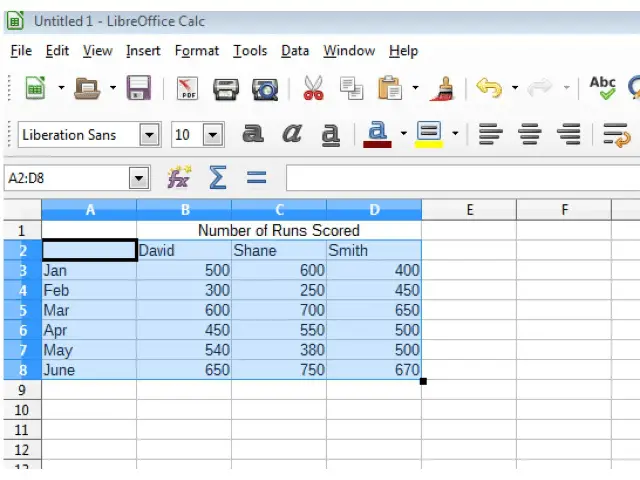
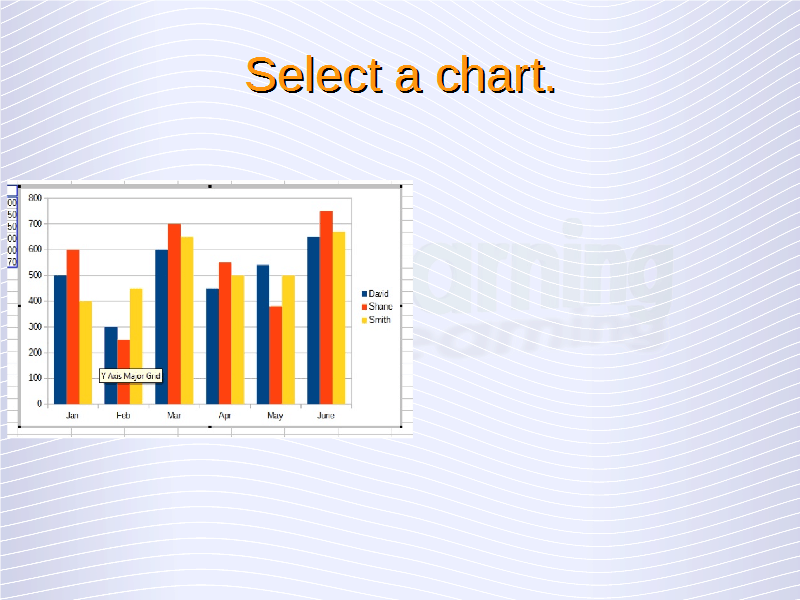
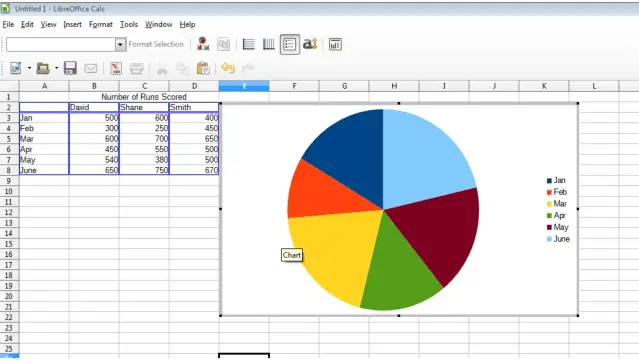
Here we have selected the data as shown in the above figure.

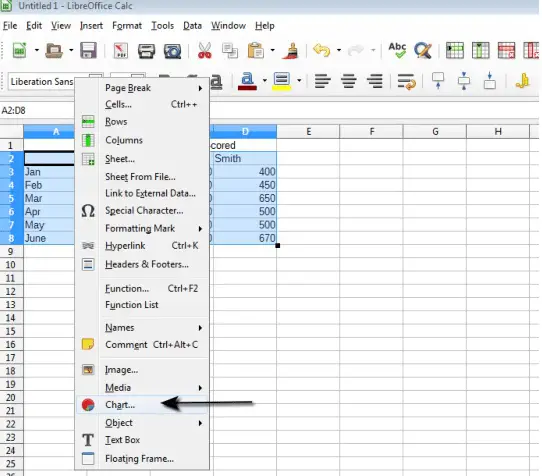
After selecting the data, click on the ‘Insert’ button from the main menu bar and from the resulting drop-down click on ‘Chart’.

This will open the chart wizard. Here you can select one of the different types of charts from ‘Choose a Chart Type’.
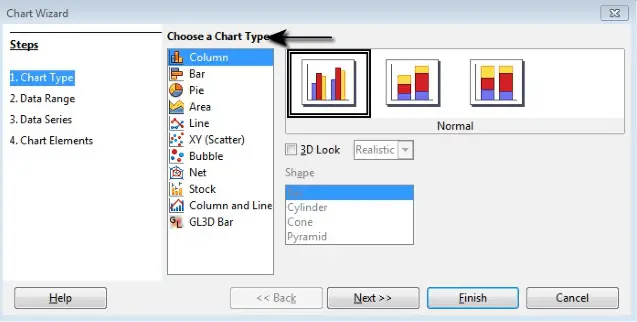

After making your selection, just click on ‘Finish’, and this will create your chart.
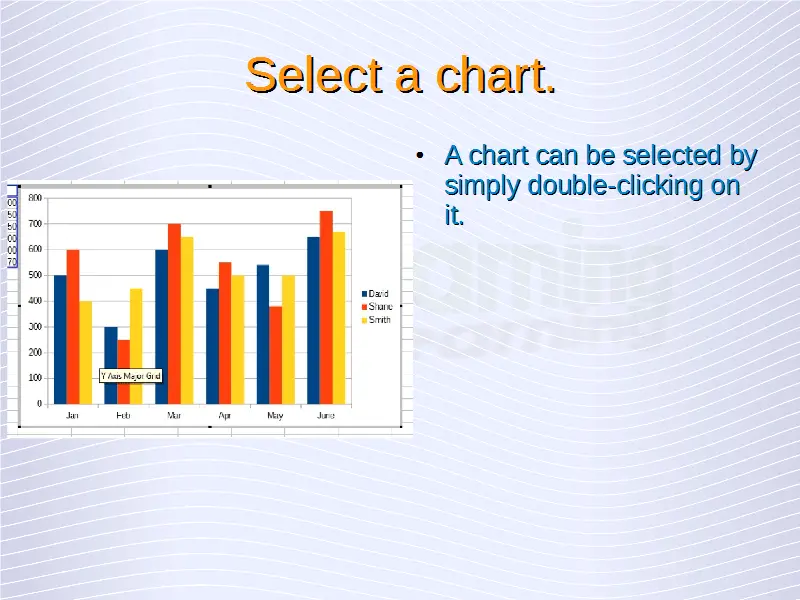
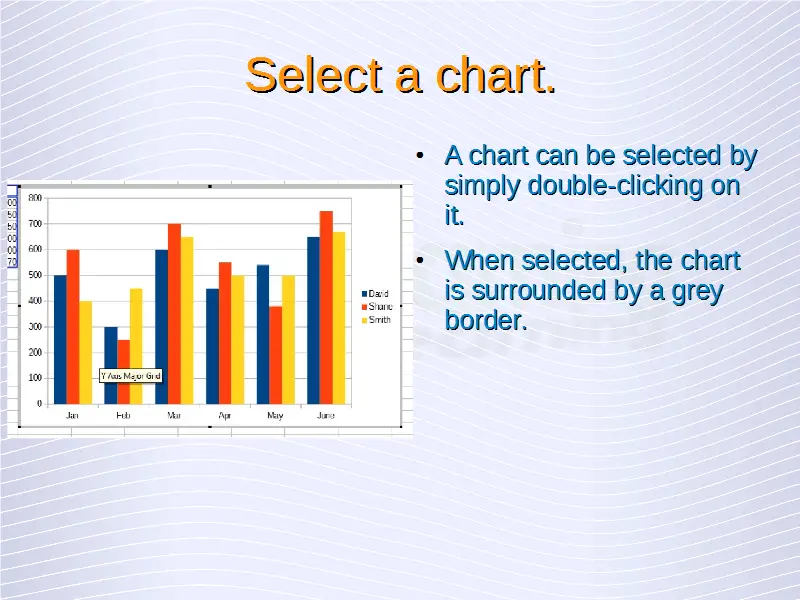
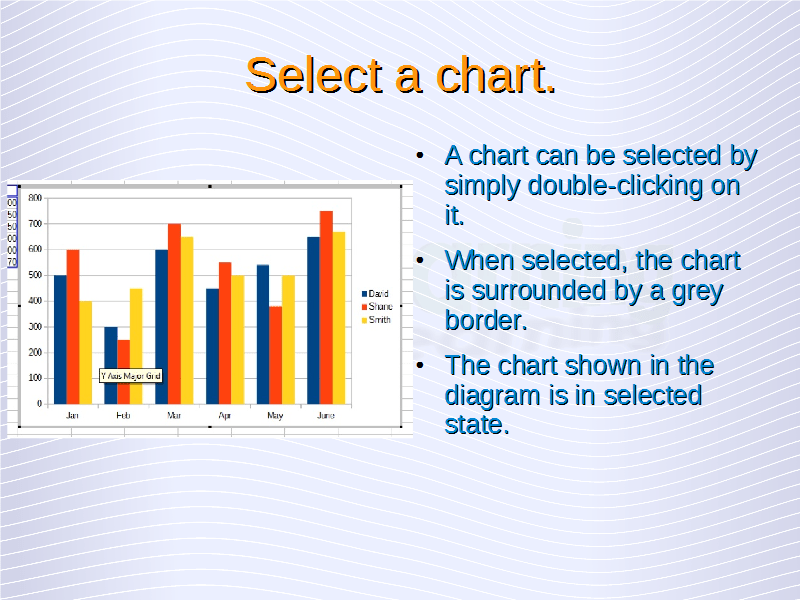
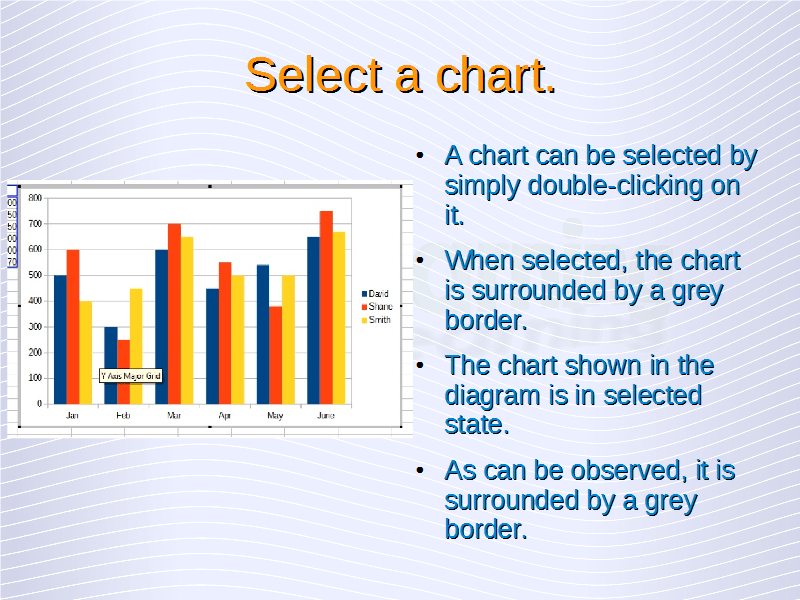
Select a chart.
A chart can be selected by simple double-clicking on it. When selected, the chart is surrounded by a grey border. The chart shown in the above diagram is in selected state. As can be observed, it is surrounded by a grey border.
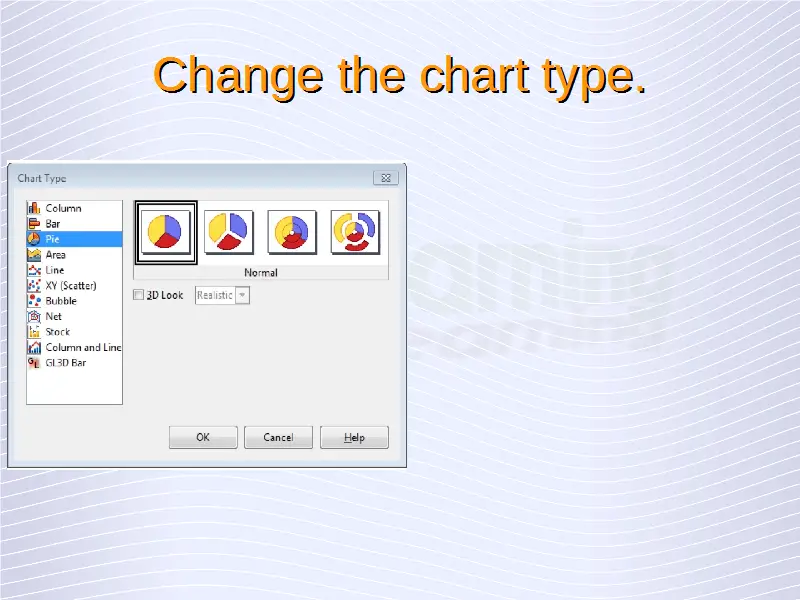
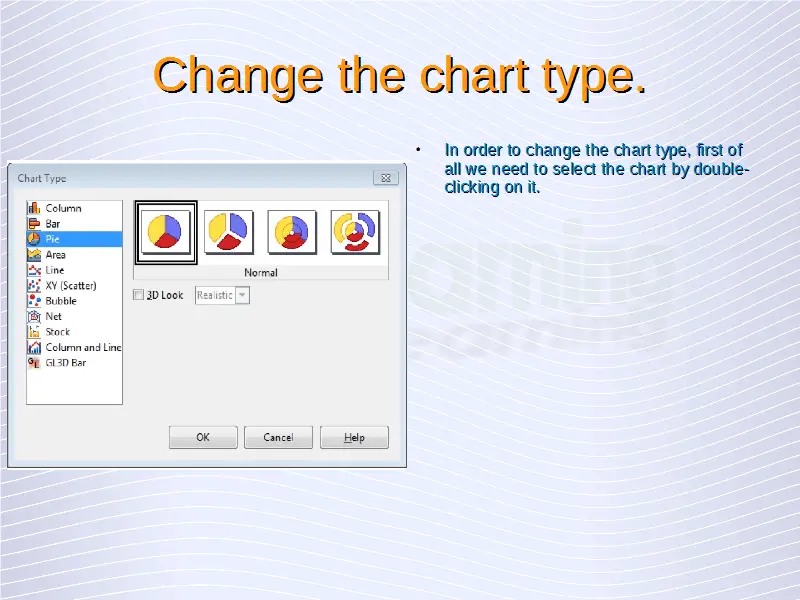
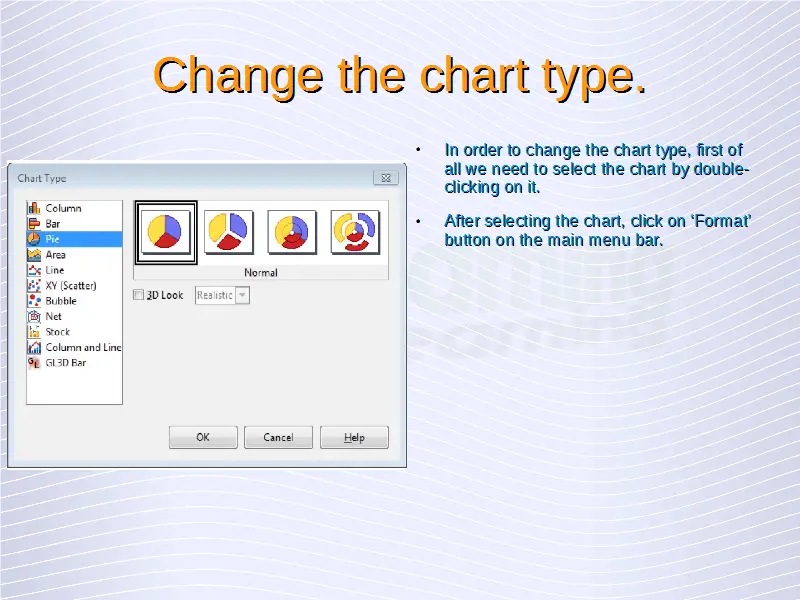
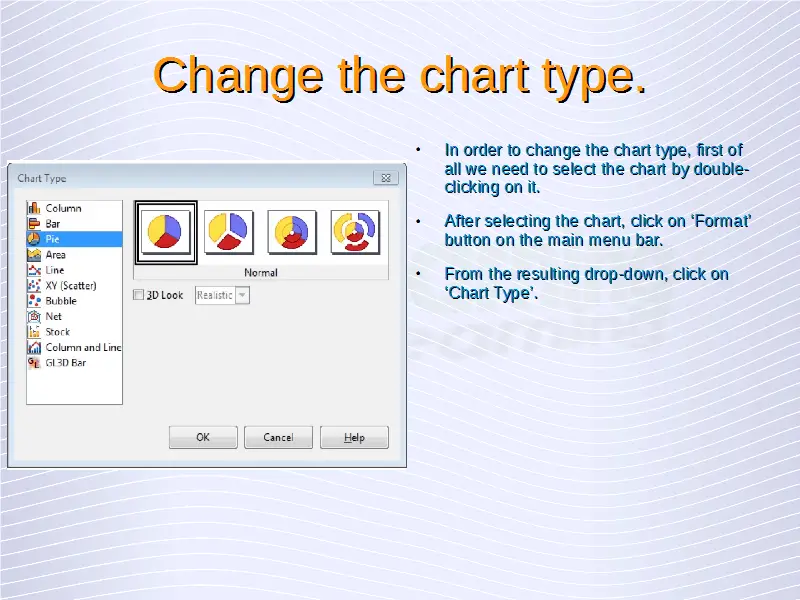
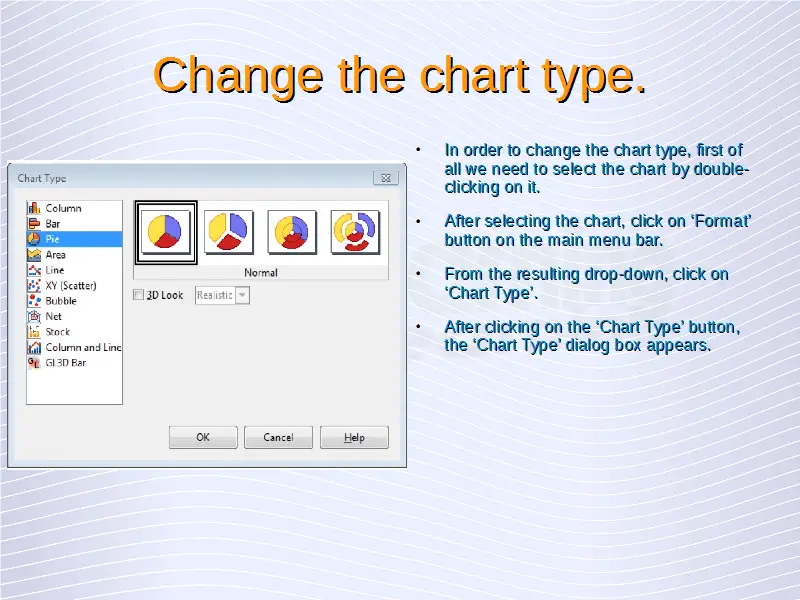
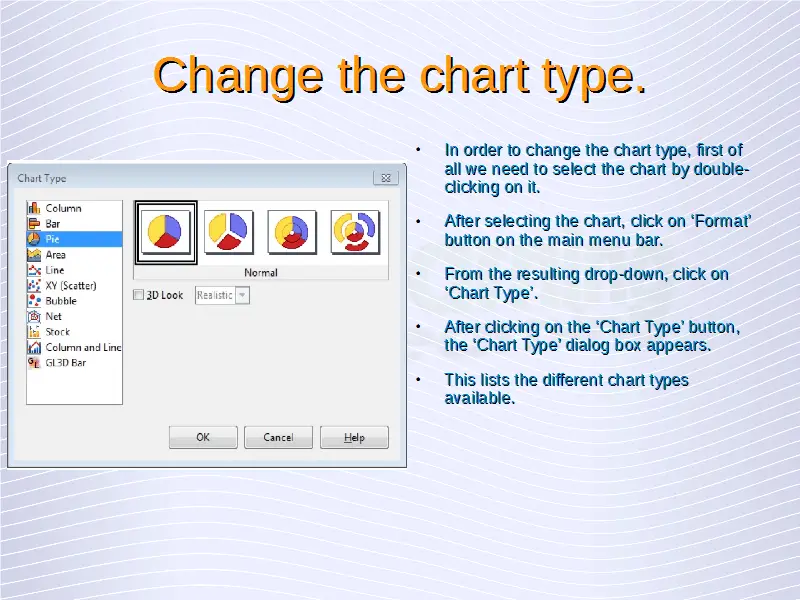
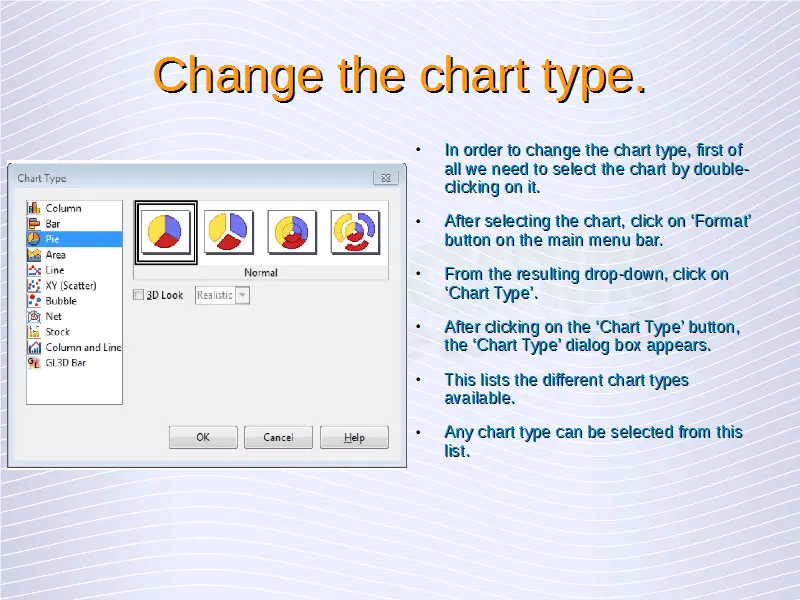
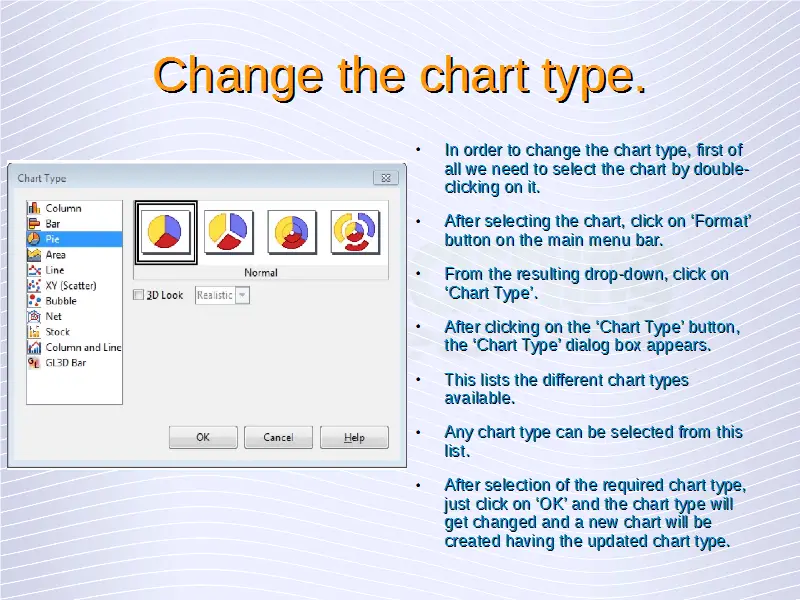
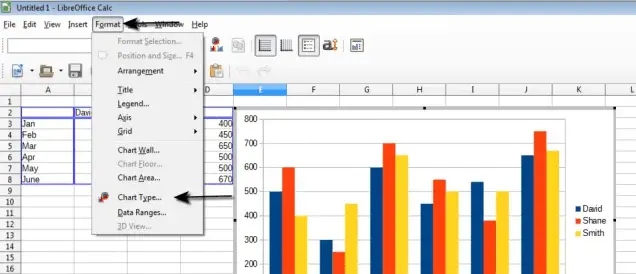
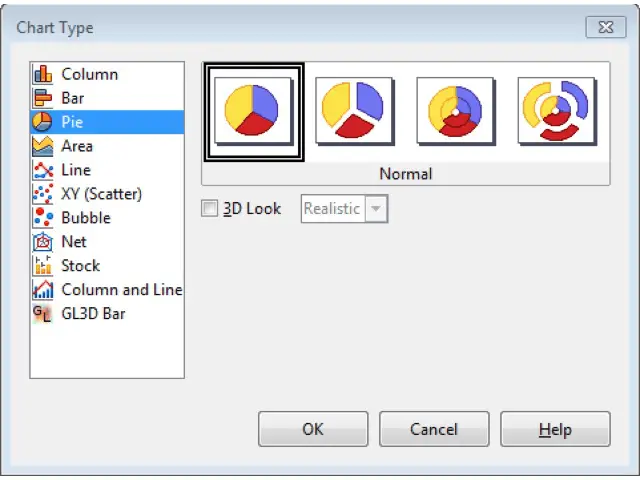
Change the chart type.
In order to change the chart type, first of all we need to select the chart by double-clicking on it. The chart will become surrounded by a grey border upon selection. After selecting the chart, click on ‘Format’ button on the main menu bar. From the resulting drop-down, click on ‘Chart Type’.

After clicking on the ‘Chart Type’ button, the ‘Chart Type’ dialog box appears. This lists the different chart types available. Any chart type can be selected from this list. After selection of the required chart type, just click on ‘OK’ and the chart type will get changed and a new chart will be created having the updated chart type.

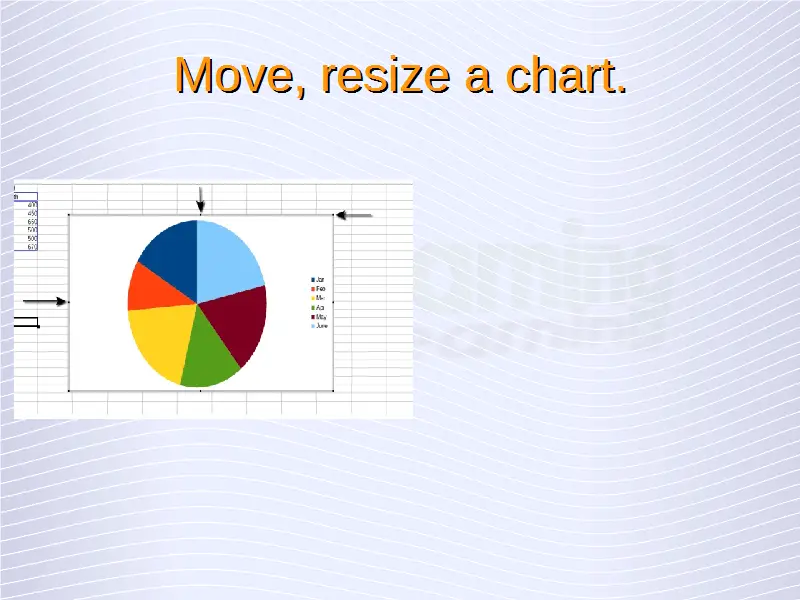
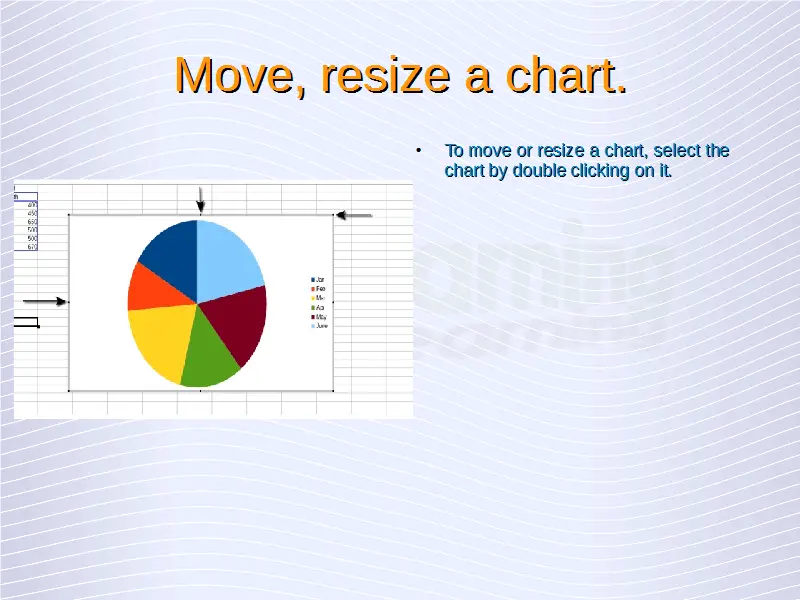
Move, resize, and delete a chart.
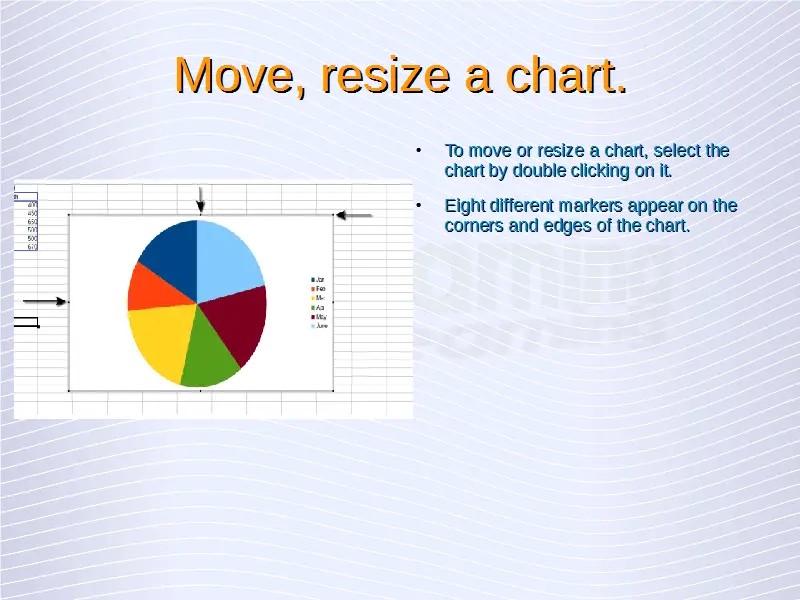
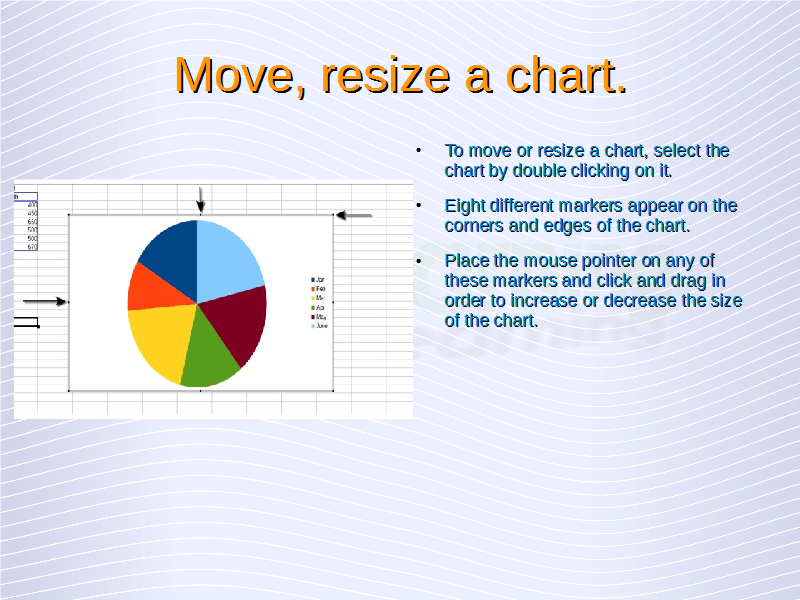
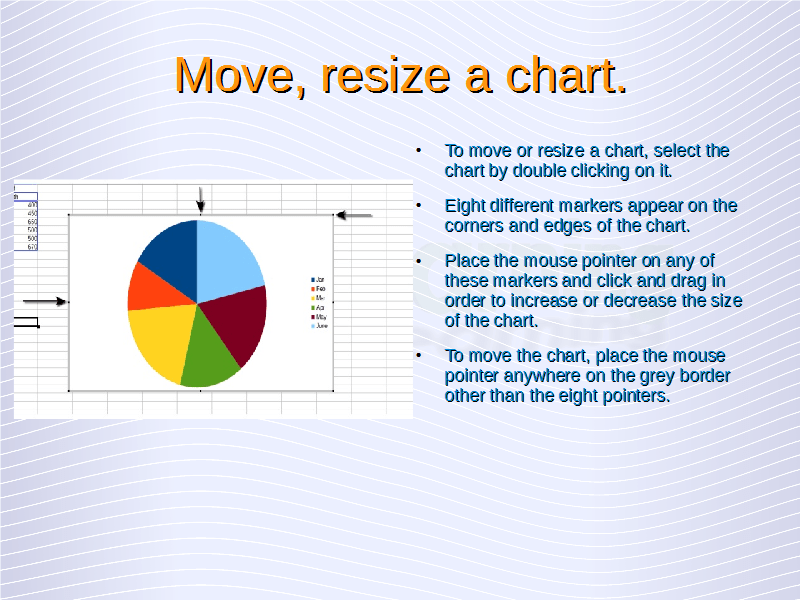
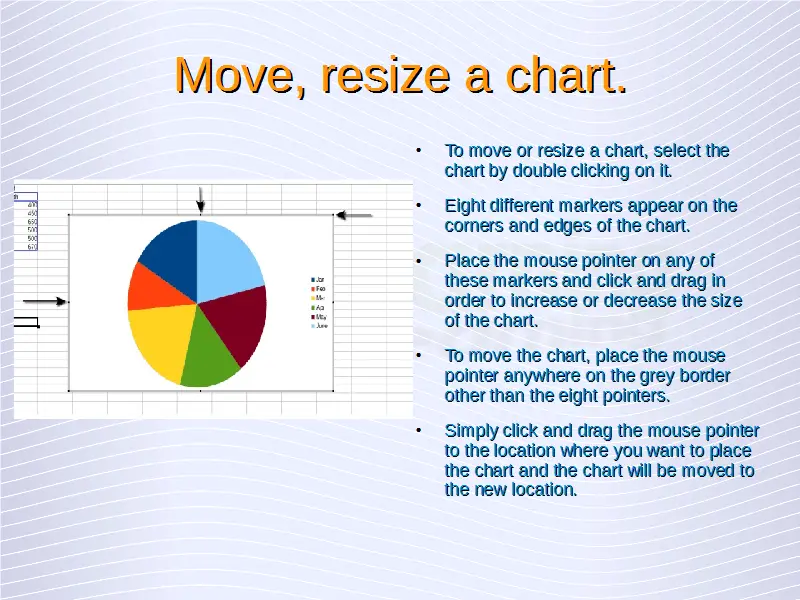
To move or resize a chart, select the chart by double clicking on it. Eight different markers appear on the corners and edges of the chart. Place the mouse pointer on any of these markers and click and drag in order to increase or decrease the size of the chart.
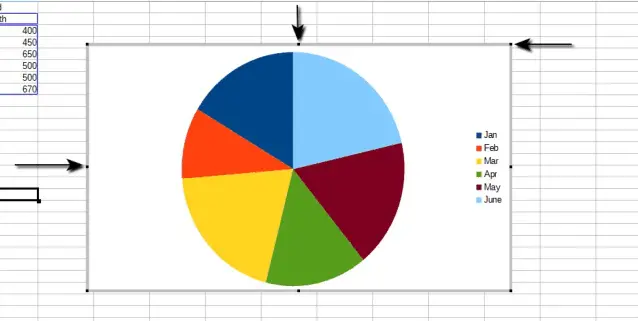

To move the chart, place the mouse pointer anywhere on the grey border other than the eight pointers. Simply click and drag the mouse pointer to the location where you want to place the chart and the chart will be moved to the new location.
To delete a chart, click on the chart only once. Eight green pointers will appear on the boundary of the chart but the grey selection border will not appear. When the green pointers appear, just click on ‘Delete’ button on your keyboard and the chart will get deleted.