Advanced Spreadsheets – Group Data
Automatically, manually group data in a pivot table/data pilot and rename groups.
Grouping data is a simple process which can be used to create groups of data and then analyzing these groups instead of analyzing the individual values. This simply means that instead of focusing on the individual values, we analyze these values as a part of a larger group. This helps enormously in simplifying the data analysis process.


To group numerical data in a pivot table, select any one cell from the entire list of cells which need be grouped. After selecting the required cell, click on ‘Data’ from the main menu bar. From the resulting menu, click on ‘Group and Outline’ and from the resulting sub-menu, click on ‘Group’. This will open the ‘Grouping’ dialog box.
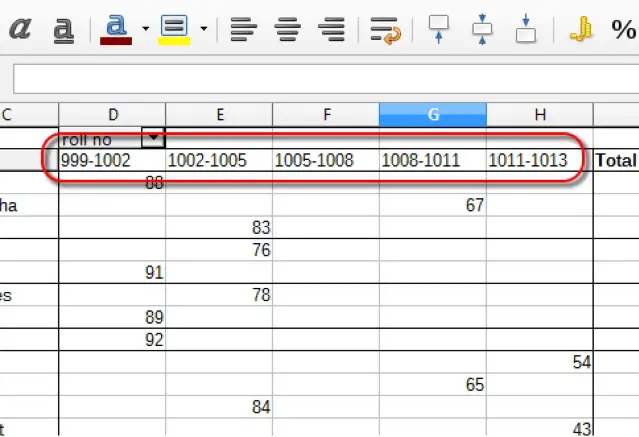
In this dialog box we have three fields, namely ‘Start’, ‘End’ and ‘Group by’. To group data automatically, select the ‘Automatically’ radio button. To group data manually, click on the ‘Manually’ radio button. If ‘Manually’ is selected, enter the start and end values and in ‘Group by’ enter the number of items per group. After making all the changes, click on ‘OK’. This will create the required groups.
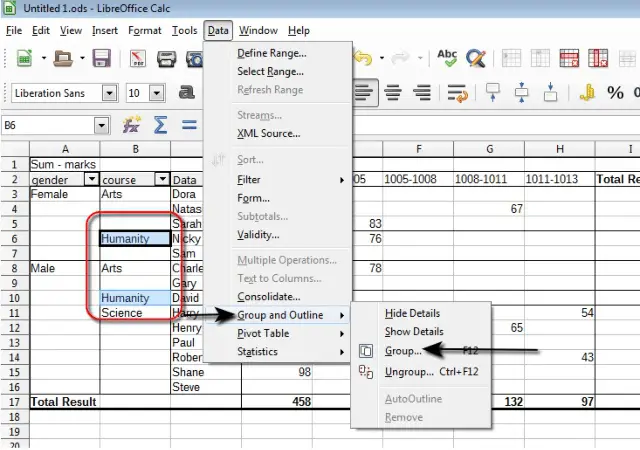
To group textual data in a pivot table, go to the column from which you want to group the data and select the values which you need to be grouped together. After selecting all the required values, click on ‘Data’ from the main menu bar. From the resulting menu, click on ‘Group and Outline’ and from the resulting sub-menu, click on ‘Group’.
This will create a new group as has been shown below.
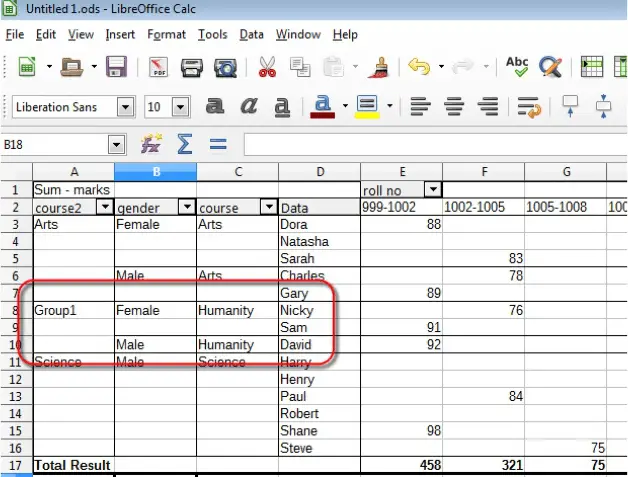
This group can be renamed simply by renaming the label of the group which has been created, which in this case is ‘Group1’.