Advanced Spreadsheets – Format chart to display an image
Format columns, bars, plot area, chart area to display an image.
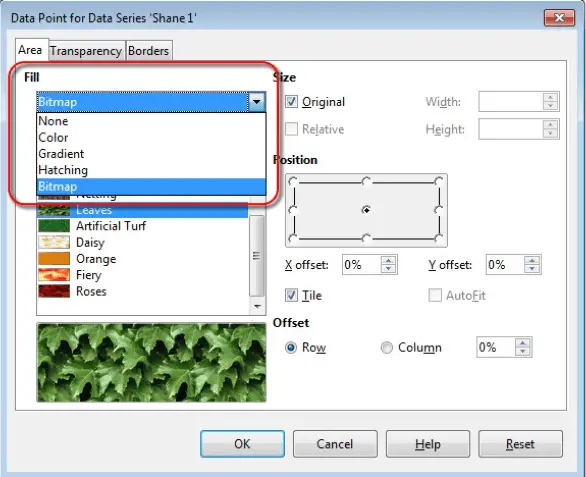
In Calc charts, we cannot use custom images by importing them into the charts from our local machine. Though Calc does provide the option for using the different types of ‘Fill’ options for the columns, bars, plot area or chart area like ‘Color’, ‘Hatching’, ‘Gradient’, and ‘Bitmap’. These options can be used to format the different components of a chart by displaying different styles and images, but custom images cannot be used in Calc.


To use the ‘Fill’ option for columns or bars, double-click on the required column or bar. This will open a dialog box, where under the ‘Area’ tab you will find the ‘Fill’ drop-down list. From this list you can choose the required fill type.
To use the ‘Fill’ option for plot area or chart area, double-click anywhere on the plot area or chart area of your chart and this will open a similar dialog box. In the same way as given above, in this dialog box under the ‘Area’ tab you will find the ‘Fill’ drop-down list. From this list you can choose the required fill type.