Advanced Spreadsheets – Statistical Functions
Use statistical functions: countif, countblank, rank.
In the same wizard, under the ‘Statistical’ category, we have the ‘COUNTIF’ function. This function counts the number of arguments which meet the set conditions. This function takes two arguments, ‘range’ and ‘criteria’. These give the range of cells to be evaluated and the criteria to be used for this evaluation respectively. These can be entered by using any of the three methods: manually, using the ‘Select’ icon, or using the ‘Function’ icon.


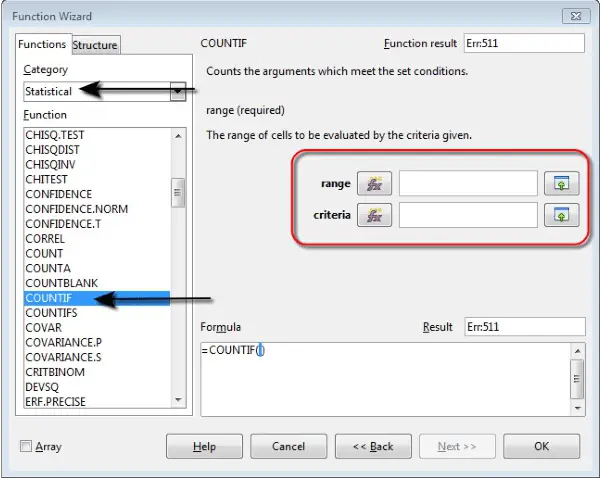
Let us take an example for the ‘COUNTIF’ function. Let the ‘range’ which is selected contains 5 cells, and the values in these cells be ‘550’, ‘450’, ‘700’, ‘380’, and ‘750’. Now let us set the ‘criteria’ as “>500”. It should be remembered that when the ‘criteria’ includes any mathematical or logical symbol, then it must be surrounded by double quotes. “>500” means greater than 500. So this ‘criteria’ will check the cells specified in the range and will only count those cells whose value is greater than 500. So here the counted cells will be the ones containing ‘550’, ‘700’ and ‘750’ and the count will come out to be ‘3’. This is what will get printed in the selected cell for the output on the click of the ‘OK’ button. This is how the ‘COUNTIF’ function works.
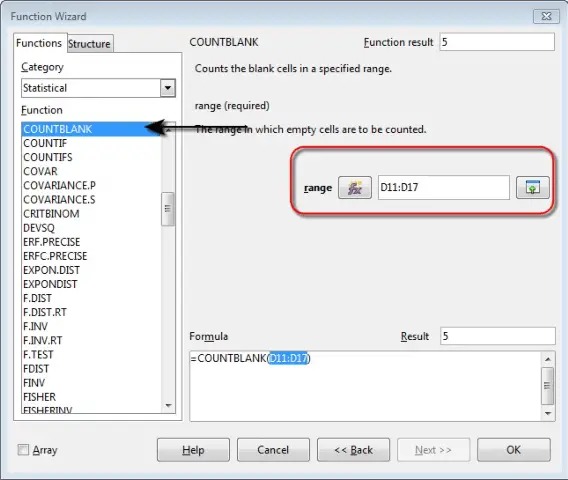
We also have a ‘COUNTBLANK’ function in the same ‘Statistical’ category. This function counts the number of empty cells in a given cell range. This function takes only one argument, ‘range’. This gives the range of cells to be evaluated. This can be entered either manually or by using the ‘Select’ icon. So if the range entered contains say 10 cells and out of these 7 contain some values and 3 are empty, then the result of the ‘COUNTBLANK’ function will be ‘3’.
We have another function in this category, called ‘RANK’. This function returns the ranking of a value in a sample data. This function takes three values, ‘value’, ‘Data’ and ‘Type’. These give the value for which the rank is to be determined, the data array and the type of ranking method respectively. These can be entered by using any of the three methods: manually, using the ‘Select’ icon, or using the ‘Function’ icon.
Say we enter the ‘value’ as ‘34’, and the selected data array under ‘Data’ contains 10 values one among which is ‘34’. ‘Type’ can be any number. If it is taken as 0 or no value is provided, then this means that the data array needs to be arranged in descending order. Any other value for ‘Type’ means the data array needs to be arranged in ascending order.
Say here we give the ‘Type’ as 0, so we need to arrange the data array in descending order. Now the data will get arranged in descending order and ‘RANK’ will return the position of ‘34’ from this arrangement. That position will be the rank of the argument. This is how ‘RANK’ function works.
![]()